
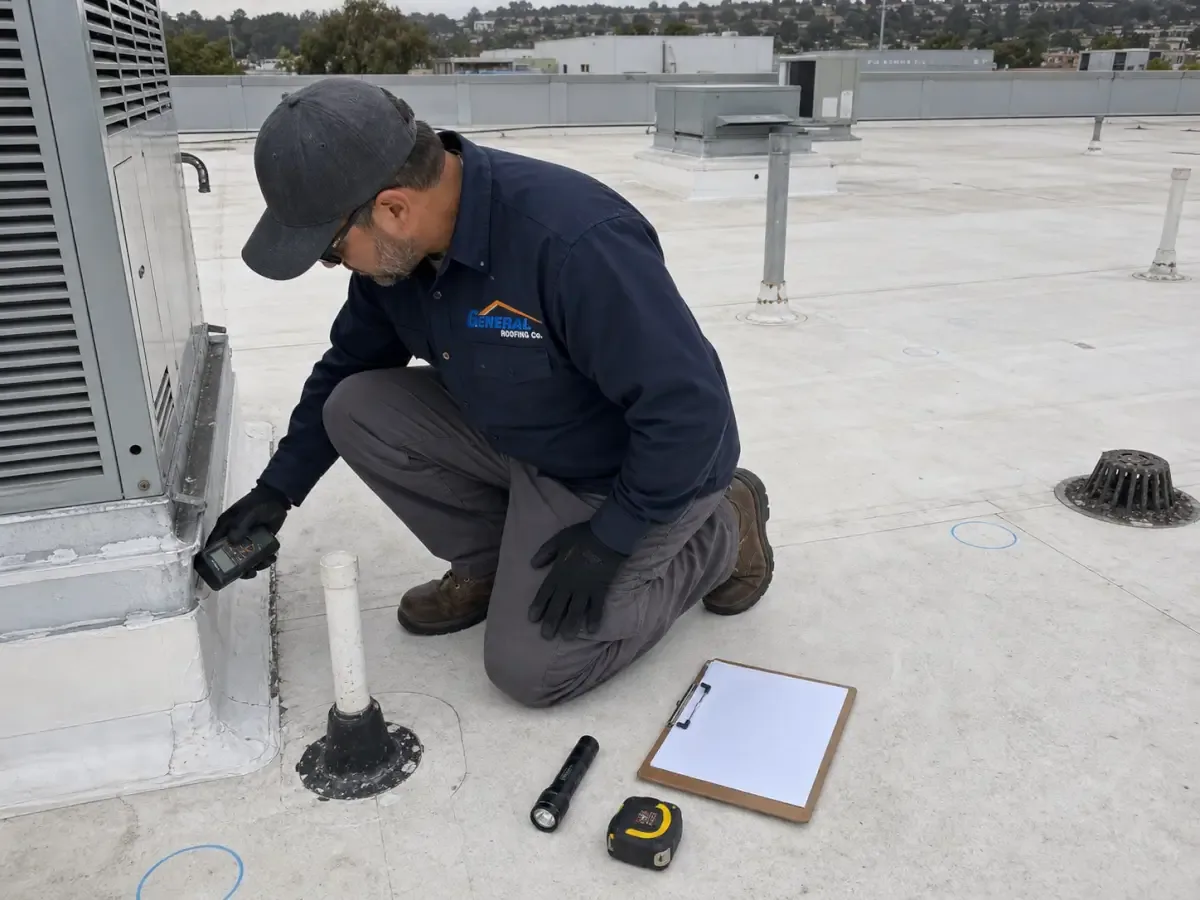
The usual way an owner learns the age of a roof is a phone call from a tenant. A stain appears, someone checks the files, and nobody can say when the membrane went down or what was done to it since. Asset management is the habit that prevents that call. It means every roof you own has a record: what it is made of, how old it is, what has been fixed and what condition it is in today. With that record, the next decision is a choice among options rather than a scramble.
What does a roof asset record contain?
A good record has a few plain parts. The first is identity: the building, the roof area, the system and the year it was installed. The second is layers: how many plies or sheets, what insulation and what deck, taken from cores rather than memory. The third is condition: the state of the membrane, seams, flashings, drains and edges, with photographs. The fourth is history: every leak, repair, inspection and bill.
The fifth part is a forecast. Based on what we find, we estimate how much service life the roof probably has left and what the next step will be, repair, coating, recover or replacement. The forecast is not a promise, since weather and use change things. It is a working estimate that the owner updates each year.
How do we build the inventory?
Walk it with me. The first step is to list the buildings and the roofs on each. A single building can have several roofs at different ages, and each gets its own line. The second step is a walk of every roof, with photographs and a note on drains, penetrations and obvious defects. The third step is a moisture scan and a few cores on the roofs that look doubtful. The fourth step is a score that puts each roof in a simple condition group.
Owners with many roofs usually start with a roof condition report on the most worrying buildings and extend the inventory outward. The goal is not paperwork for its own sake. It is a map that shows which roofs can wait and which cannot.
Photographs gain value as the years pass. A dated picture of a seam, a drain or a flashing is proof of what the roof looked like then, and it lets the next walk compare like with like. We shoot from marked spots so the angle is repeatable, and we label each frame with the roof, the date and the item.
How are roofs ranked against each other?
We rank by three questions. How likely is this roof to leak in the next year or two? How much damage would a leak do to what is below it? How much would repair or replacement cost, and does anything on the building make that harder? A roof over a data closet or a clinic scores higher on consequence than one over an empty storeroom, even if the membranes are the same age.
Ranking turns a long list into a short one. The top of the list gets attention first, the middle gets scheduled maintenance and the bottom gets a watching brief. The ranking changes as roofs are repaired and others age, so we revisit it at each inspection. A capital plan then turns the ranking into dates and budgets.
Ranking also guards against a common trap: spending on the roof that complains loudest. The roof that leaks into a lobby gets attention because people see it, while a quieter roof with wet insulation is aging faster. A moisture scan puts numbers behind the quiet roofs.
What does the Queens building mix mean for the record?
Queens roofs vary as widely as the borough's economy, which is the most diversified of the five boroughs and produced a 2024 GDP near $111.1 billion. Long Island City's former factories and bakeries now serve new uses, so an inventory there lists old masonry industrial roofs beside newer mixed-use ones. Yellow-brick rowhouses from the early twentieth century and mill-era buildings fill Ridgewood and Glendale, and much of that stock sits in historic districts. The Maspeth Industrial Center lies on industrial lowlands, and College Point Corporate Park spreads over about 550 acres.
An owner with buildings in more than one of those places holds roofs of many ages and systems. A file for a roof in Long Island City and one in Maspeth use the same format, so a Queens portfolio can be compared line by line.
How do storms and seasons enter the record?
Storms become entries in a roof's history. Maspeth had six feet of water from Hurricane Sandy in October 2012, and on September 1, 2021 Hurricane Ida's remnants led the city to declare its first flash flood emergency, with Queens bearing most of the deaths. After each event we note which roofs ponded, which drains backed up and which edges lifted, since those are the roofs most likely to fail next.
Seasons count too. The inventory notes climate stress too: Central Park averages close to 85 degrees in July with the heat island strong, winters deliver about 29.8 inches of snow, and 27.3 inches landed on January 23, 2016. A roof inspection after the winter and another after the summer keeps the record current.
What does an owner do with the record?
The record answers four questions. Which roof should be repaired this year? Which should be budgeted for replacement and when? Which has a warranty that is still in force? And what should a buyer or lender be told? Each answer comes from a line in the inventory rather than from memory. When a leak happens, the file shows the roof's age and the last repair, which shortens the diagnosis.
For owners who hold many sites, the record feeds a multi-site roof program. For owners preparing a sale, it supports a due diligence roof survey. The next step is to start with the roofs that worry you most and let the inventory grow from there.
The record also helps with people. A property manager can show an owner why one roof is getting money this year and another is not. A lender can see that a building has a plan. A tenant who calls about a drip gets an answer based on facts, not a guess about what might be above their ceiling.
Questions Owners Ask
What building owners and managers usually ask before a roof visit.
One building is enough to benefit, because a record of age, layers and repairs saves time when a leak happens. The effort and the value both grow with the portfolio, so start with the roofs that worry you. Even one or two roofs gain from knowing the layers before a leak forces the question.
We update it at each inspection and after each repair, and the owner holds a copy. Property managers can add their own notes about leaks and complaints. A shared file is better than two separate ones.
No record can predict a failure date. It can show how a roof is aging compared with similar roofs and flag the signs that come before leaks. That is enough to schedule work ahead of the problem.
The cost depends on the number of roofs, access and how much testing is needed. A walk and photographs cost less than moisture scans and cores. We scope the first pass to the roofs that matter most and expand from there.
Send a list of buildings with addresses, plus any roof plans, repair invoices or warranty papers and photos of the roofs that concern you, and the first entries can be built.
Related Roofing Work
Other pages that connect to Roof Asset Management.

Roof Condition Reports
Written roof condition reports in Queens, NY: photographs, moisture findings, ratings and ranked recommendations an owner, lender or insurer can read.
Roof Capital Planning
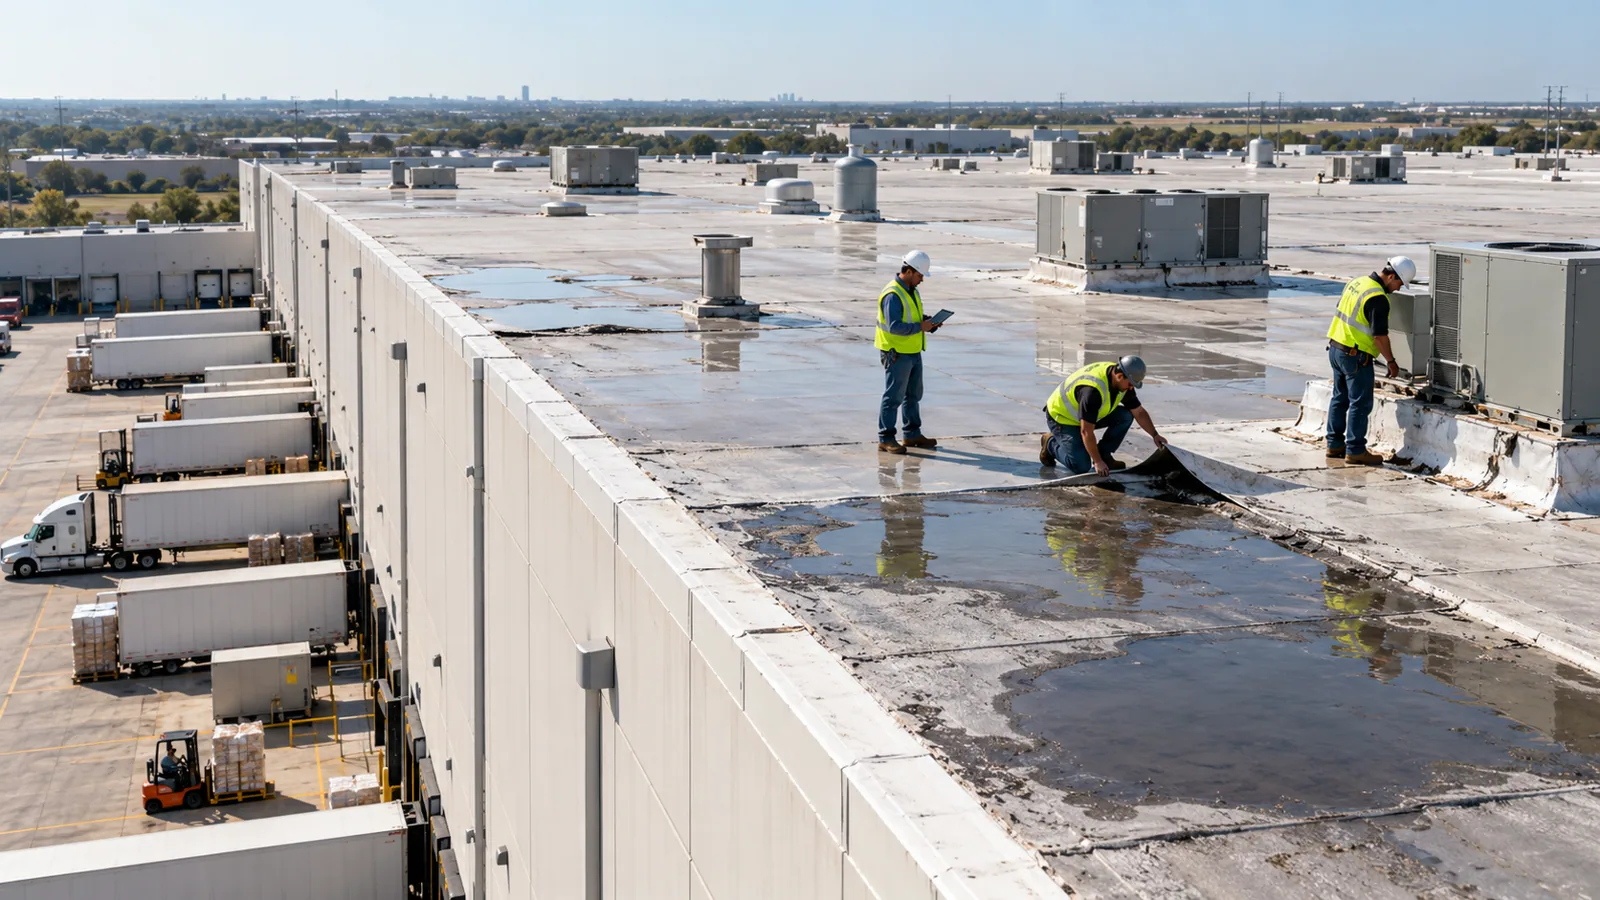
Roof capital planning in Queens, NY: budgets and replacement timing built from moisture data, condition ratings and building plans, so roof work is scheduled.
Long Island City
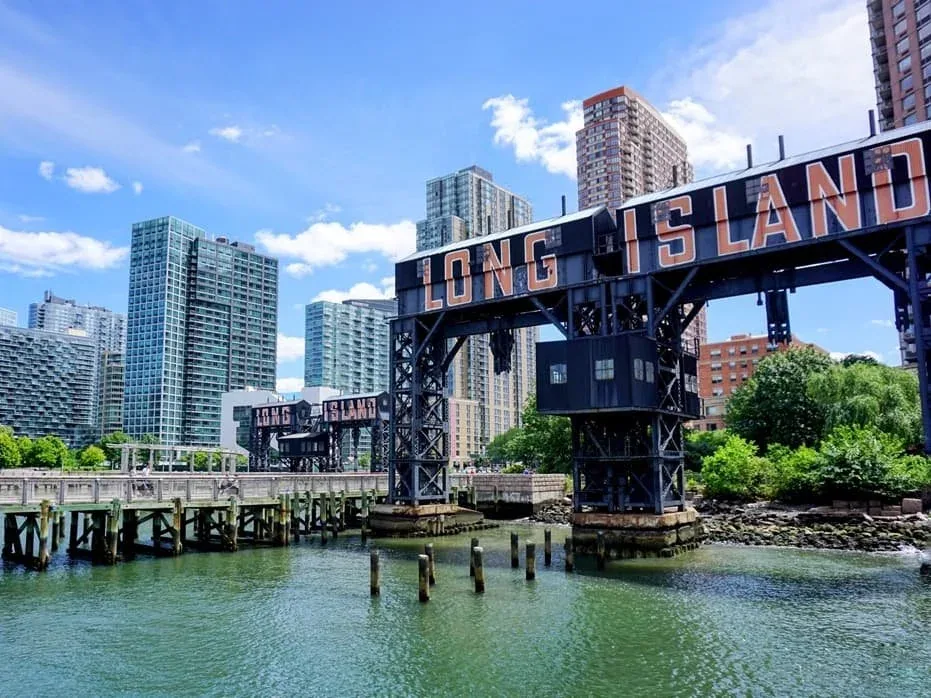
Commercial roof repair and replacement in Long Island City, Queens, NY, for masonry industrial buildings, converted factories and newer mixed-use roofs.
Ready to Talk About Roof Asset Management?
Tell us about the building and what you are seeing. We will schedule a roof walk and send photos and a written scope.